Originally published at dbhurley.com.
Recently I decided to do a little digging into Mautic’s contributor logs to see who was doing big things when it comes to Mautic’s marketing automation code. I also wanted to compare how we compared 2016 to 2017 since we’re fast approaching the end of 2017. It seems hard to believe that we’re almost ready to close the book on another year!
I thought the best thing to do would be to look at a variety of stats first comparing different metrics between last year and this year. One thing that I believe is very important to mention at the beginning before we start looking at specific numbers is how much of Mautic community growth can NOT be measured by a number or a specific number of lines of code. The following metrics simply report on one aspect of the overall community and should in no wise be considered indicative of the community as a whole (good or bad). The code aspect is merely one facet of our community.
Number of Developers
The number of developers contributing code to Mautic can be viewed in several different ways so I’ll share a few of them and let you draw your own conclusions.

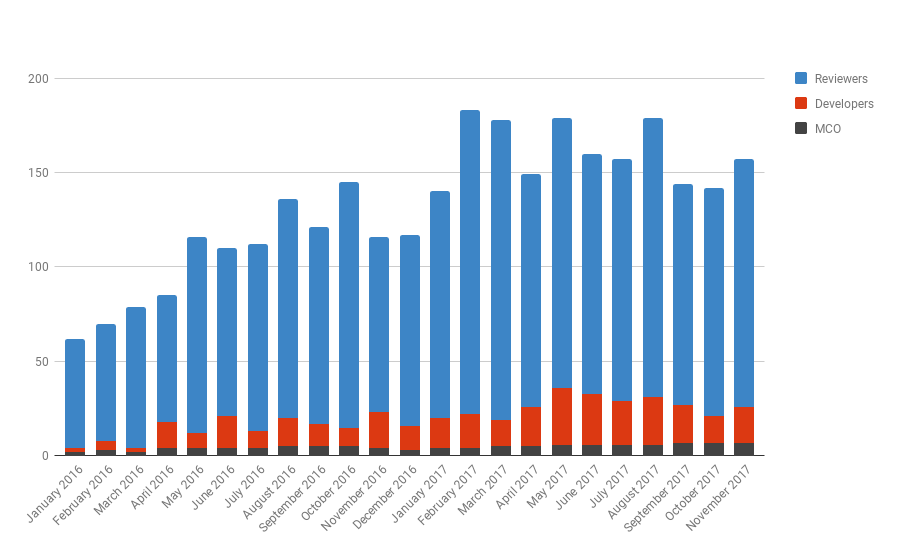
This first graph shows the growth of developers and reviewers over the past two years. As you can see we have a steady increase in the number of “contributors” over the past 24 months. This time period covers Mautic versions 1.2 through 2.11 and does not include the month of December of this year, 2017. There are significantly more reviewers than developers but this is expected and both are still considered contributors as Mautic requires reviews to be done before a pull request can be merged. The Mautic company is identified by the dark grey in the chart as well. You can see that although proportionally Mautic the company (MCO) contributes the greatest number of developers than other companies there are increasingly more and more months developers and reviewers from the community.
There is an important side note that should be considered when reviewing the number of contributors and the relationship between MCO engineers and community developers. The amount of code contributed by MCO engineers comprises approximately 82%. This means that although the number of developers in the community is increasing MCO is still the largest single contributor by a significant amount.
But just to give a bit more recognition I’d like to share a specific list of the top 20 individuals who have contributed code to Mautic in the past year. This list isn’t exhaustive; there are many more (as the stats above demonstrate). But these individuals deserve a special specific callout for their work. Here is a list of the top 20 individuals and the number of lines of code they have contributed to Mautic.
-
- alanhartless*, 91179
- escopecz*, 55362
- dongilbert*, 39954
- mqueme*, 33581
- stollz, 22008
- virlatinus*, 20850
- GaberNeighbor*, 12113
- Maxell92*, 10950
- kuzmany, 6768
- thecodeine, 5525
- drmmr763*, 5287
- npracht, 3783
- MarkLL, 2541
- mikegillis677, 2309
- Woeler, 1546
- shulard, 1439
- jordan8037310, 964
- isleshocky77, 750
- lightweight, 678
- Dreiser*, 634
But code contribution is more than just lines of code. (I’ll be the first to suggest that the number of lines of code may be a terrible metric for judging activity…more on that later). So here is a second list. This list recognizes the top 20 individuals and the number of merged pull requests to the Mautic code. Again, they each deserve recognition for their contributions.
- alanhartless*, 628
- escopecz*, 390
- mqueme*, 150
- dongilbert*, 98
- kuzmany, 83
- virlatinus*, 76
- mbabker*, 37
- MaxWebmecanik*, 27
- drmmr763*, 23
- Dcoutelle, 18
- isleshocky77, 16
- arulrajsm28, 12
- phil-davis, 11
- shulard, 11
- SamWebmecanik, 11
- chandon, 10
- jordan8037310, 9
- Woeler, 9
- npracht, 9
Comments & Pull Requests
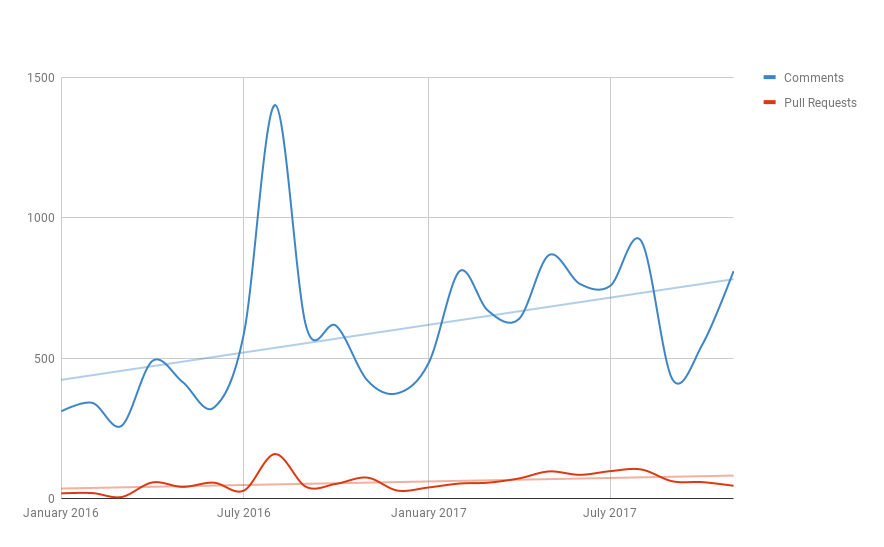
The second chart I would like to share with you is in relation to the overall comments and pull requests that the Mautic codebase has received over the previous 24 months.

This chart highlights the pull requests (in red) and the comments (in blue) as they have occurred since January 2016. Here again we see a gradual increase in contributions (trend lines added). As you would expect the amount of discussion surrounding code contributions increases over time and there is a gradual increase in the number of pull requests submitted as well. Peaks typically correspond with the various release dates of the Mautic code.
Code Comment Growth
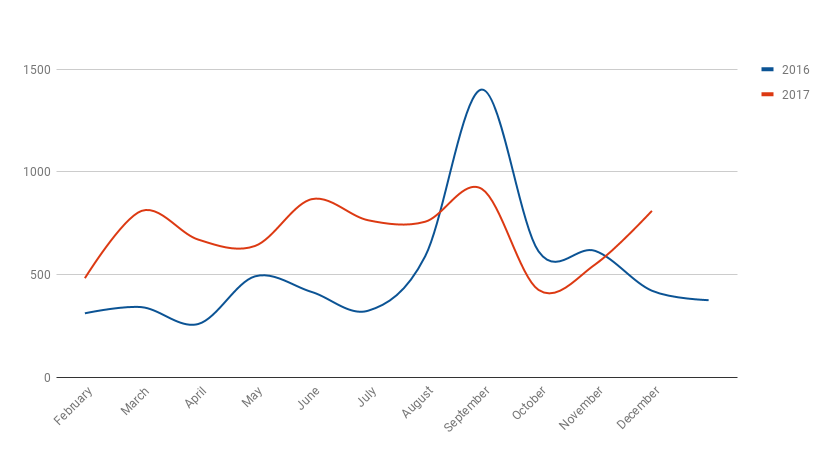
The next chart demonstrates a comparison between comments on code between last year and this year (again keeping in mind that this year we are not showing data from the month of December).

I share this chart because it signifies the engagement aspect from the community. Again, comments and involvement increases around release times as you would expect, but the overall trend line demonstrates increased discussion occurring around the code over time.
Of course all of these charts above are specifically related to the pull requests submitted and as a result there is a significant portion of the contributor engagement that is not represented by these charts. The reason for this lies in the feature request section of GitHub. Feature requests are ideas generated by the community for future consideration within Mautic. Because they are not associated with a specific pull request they do not show in the above stats.
Current Code Status
Let’s now take a look at our current GitHub status and repositories and draw some conclusions about where we have come and where we are going to go from here. This is also a chance to identify ways we need to improve processes and new areas of focus for 2018.
Currently in GitHub there are 726 issues and 103 pull requests. Breaking the issues down further we have the following stats:
- 321 issues marked as Bugs
- 308 issues marked as Feature Requests
- 171 issues marked as Backlog
- 98 issues not labeled
- 20 issues marked as Pending Feedback
There are several conclusions we can draw from this. First, because we use GitHub for our bugs and feature tracking there is a slight skewing of perception when viewing the open issues on Mautic. Instead of there being almost 730 “bugs” in Mautic code, it is better to view this list with the appropriate filter applied. When you do this you’ll find that the relationship of bugs to pull requests is much closer to a reasonable ratio with 1 pull request existing for every 3 bugs.
The second item that is a problem for Mautic is the 98 issues that are currently unlabeled. This means someone has written up an issue but it has not been reviewed by anyone with appropriate permissions for applying a label. This is a problem. There are two possible explanations. Either we don’t have enough active community members monitoring the GitHub repositories to mark new issues with the appropriate labels or we don’t have enough community members with the knowledge to apply the appropriate labels and therefore they don’t add them.
Side Note: There’s also the problem presented by GitHub repositories and permissions that allow or disallow access to label creation and application of those labels. This is something Mautic has not yet solved successfully.
In the future we need to educate community members on reading and assigning labels to issues so that they can be correctly categorize as they are created. We also need to determine the number of community volunteers actively monitoring GitHub repositories. One of the first ways we can determine this number is by looking at the number of reviewers we saw in the charts earlier. This number gives a suitable estimates of those contributors capable of responding to issues and therefore also capable of attaching labels to issues.
There are several advantages to correctly categorizing issues. With proper categorization we can more readily identify which bugs need to be resolved first and which are feature requests instead of actual bugs. This will increase productivity from the developers writing pull requests as well as clarify public understanding of the project’s status.
Lastly, from the list of issue stats we can see that there are a significant amount of feature requests. We can draw a conclusion or two from this metric as well. Feature requests can mean the software is not completely fulfilling everyone’s ideal marketing solution (though this is a more delicate issue as Mautic should never attempt to be all things for all people). More importantly the relationship between number of feature requests submitted and number of pull requests submitted suggests that the community is made up of more end-users (marketers) or implementer types of users rather than coders or developers. In fact, when we take this ratio and compare it to the downloads from Mautic.org of the software we find a fairly similar breakdown of user types. This means the assumption we draw from the feature request submissions is accurate.
Understanding the make-up of our community when it comes to the Mautic code helps us to continue making improvements and growing. I hope that as you have read through this you’ve been able to get a better understanding of how I look at things and what the different metrics you might see or hear actually mean. Once we have a shared understanding of how to look at the Mautic codebase we will have a greater opportunity for moving faster.


